Inside Anthropic's S-1: Big Tech's Circular AI Handshake and the $500B 401(k) Timebomb
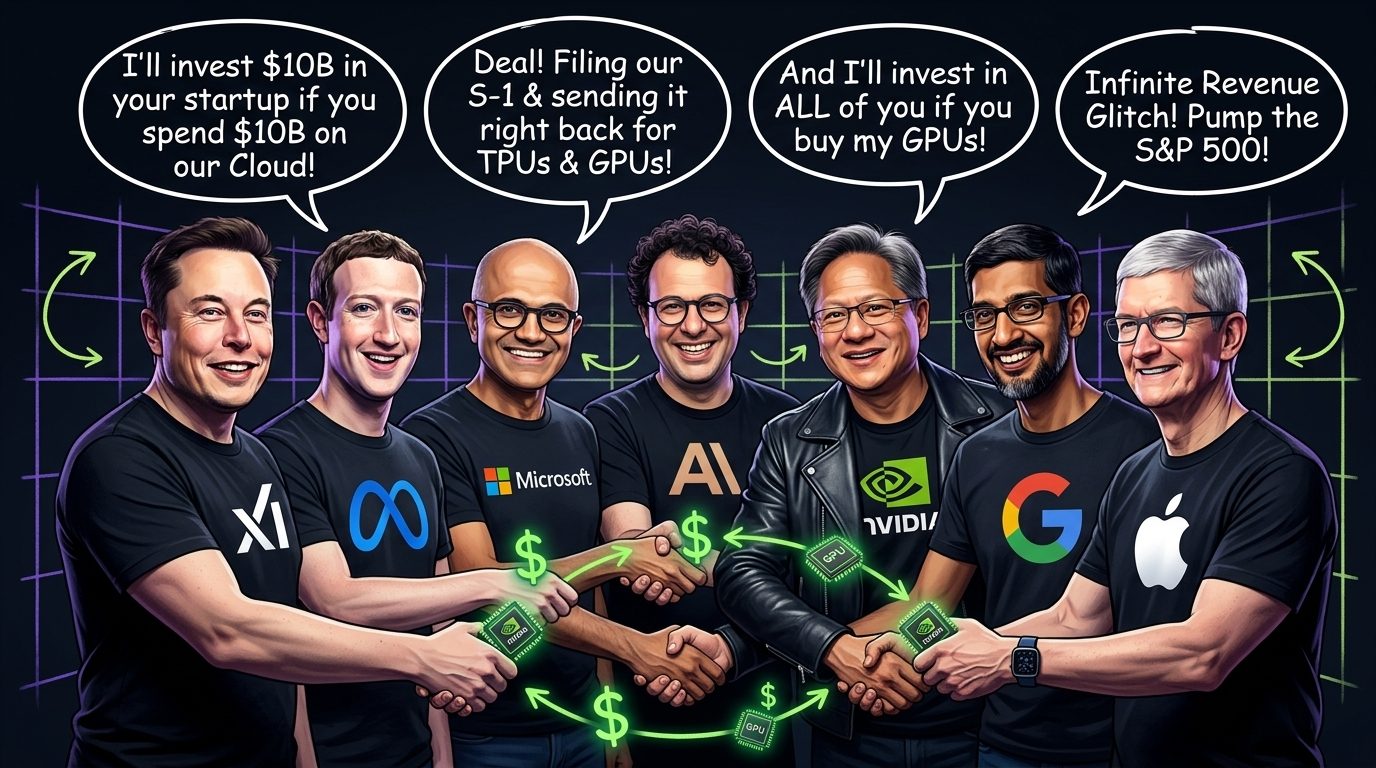

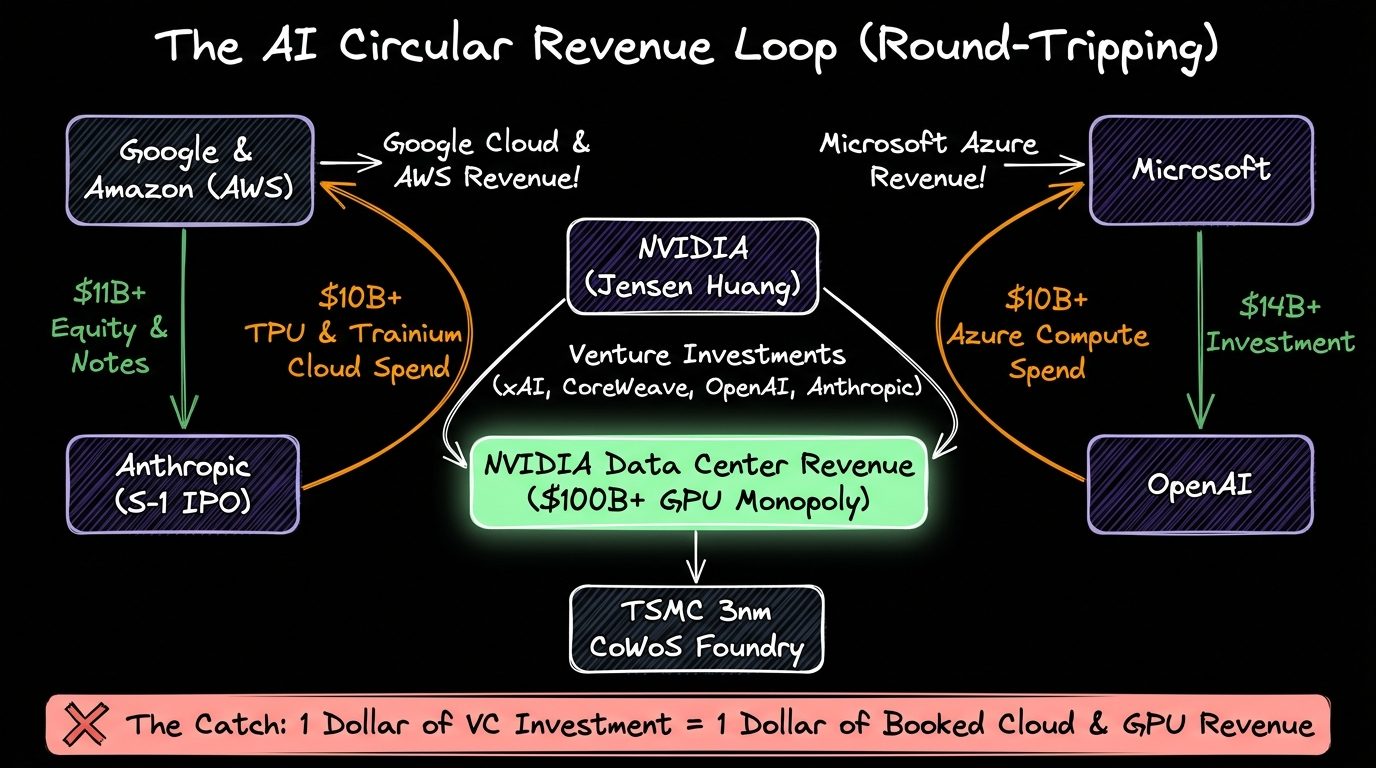
Every tech keynote this year tells you we are witnessing a historic free-market explosion in artificial intelligence demand. Then you open Anthropic's Form S-1 SEC registration statement for its proposed Nasdaq IPO under ticker ANT and realize that a massive chunk of Big Tech's AI revenue is actually the same pile of cash being passed in a circle between seven CEOs.
On October 26, 2026, Anthropic officially announced its S-1 filing with the SEC. Within minutes of the EDGAR upload (CIK 0002130357, Accession No. 0001628280-26-067168), developers and financial analysts started digging through the footnotes. What those footnotes reveal is not just the story of Claude. It is the blueprint for a $500B+ circular vendor-financing loop connecting Sundar Pichai (Google), Satya Nadella (Microsoft), Jensen Huang (NVIDIA), Mark Zuckerberg (Meta), Elon Musk (xAI and Tesla), Tim Cook (Apple), Andy Jassy (AWS), and Dario Amodei (Anthropic).
Anthropic has filed an S-1 registration statement with the SEC related to its proposed IPO. Read more: anthropic.com/news/s1-sec Legal disclaimer: A registration statement relating to these securities has been filed with the SEC but has not yet become effective. These securities may not be sold nor may offers to buy be accepted prior to the time the registration statement becomes effective.
October 26, 2026Open conversation on X →
Inside Anthropic's Form S-1: $16.3B H1 Revenue, an $80.7B GAAP Loss, and $518B in Cloud Lock-In
Let's look at the raw numbers inside Anthropic's S-1 filing (anthropicpbc-sx1.htm) before we trace where the money goes. On the surface, Anthropic's top-line growth is the fastest enterprise software ramp in Silicon Valley history, driven by Claude Code and enterprise API adoption. Full-year revenue jumped 12x from roughly $381 million in FY 2024 to $4.6 billion in FY 2025. In the first six months of 2026 alone (H1 2026), revenue hit $16.286 billion, with Q2 2026 generating $11.555 billion in a single quarter.
Then you look down the income statement and contractual footnotes, and two massive realities jump off the page:
- The $80.748 Billion H1 2026 GAAP Net Loss: While Anthropic narrowed its H1 2026 core operating loss to $693 million and generated $3.929 billion in positive operating cash flow, its GAAP net loss for those six months was a jaw-dropping $80.748 billion. Why? Because $72.388 billion of that loss came from non-cash mark-to-market revaluations of convertible notes and derivative liabilities issued to hyperscaler backers like Amazon and Google as Anthropic's private valuation surged toward $965 billion.
- The $518 Billion Take-or-Pay Cloud Mortgage: As reported by The New York Times on Google's $40B Anthropic commitment, Google committed up to $40 billion ($10 billion immediate cash plus $30 billion milestone-contingent financing) on top of its earlier $3B+ stake, while Amazon expanded its $8 billion investment by up to another $25 billion (up to $33 billion total). In exchange, Anthropic signed non-cancellable multi-year cloud purchase commitments totaling $111.1B to $114.5B to Google Cloud through July 2033, $110B to AWS through April 2036, and $31.4B to $44.9B to Microsoft Azure through 2033. Including Broadcom TPU leases and GPU neoclouds, Anthropic is locked into roughly $450B to $518B+ of fixed infrastructure obligations over the next decade, with nearly 80% structured as rigid take-or-pay contracts.
- The 16% Cloud Marketplace Toll: In 2025, 47% of Anthropic's total revenue ($2.16 billion) flowed through AWS Bedrock and Google Cloud Vertex AI marketplaces. For every dollar an enterprise spends on Claude through Bedrock or Vertex AI, Amazon and Google skim roughly 16 cents off the top in distribution fees before Anthropic pays those exact same clouds billions more to rent the underlying Trainium2 and TPU silicon.
| S-1 Metric / Governance Tier | Filing Figure (SEC CIK 0002130357) | Counterparty / Holder | Why It Matters for Developers & Investors |
|---|---|---|---|
| H1 2026 Revenue vs. FY 2025 | $16.286B (H1 2026) vs. $4.6B (FY 2025) | Claude Code, API & Enterprise | 14x YoY H1 growth, but 47% of 2025 sales ran through AWS/GCP marketplaces at a ~16% fee. |
| H1 2026 GAAP Net Loss | -$80.748B (-$693M operating loss) | Convertible Note Holders (AMZN, GOOGL) | $72.388B is non-cash fair-value adjustment on convertible debt as valuation hit $965B. |
| Google Cloud Purchase Obligation | $111.1B to $114.5B (2026 to 2033) | Alphabet / Google Cloud (TPU v5p, Trillium) | Paired with Google's up to $40B investment commitment; recycles cash into GCP revenue. |
| AWS Purchase Obligation | $110.0B (2026 to 2036) | Amazon Web Services (Trainium2, Bedrock) | Paired with Amazon's up to $33B investment; locks Anthropic into AWS custom silicon. |
| Microsoft Azure Obligation | $31.4B to $44.9B (through 2033) | Microsoft Azure AI Foundry | Even OpenAI's biggest backer gets tens of billions in guaranteed Anthropic cloud spend. |
| Total Compute Commitments | $450B to $518B+ (~80% Take-or-Pay) | GCP, AWS, Azure, Broadcom, Lambda, Nscale | Anthropic must pay for multi-gigawatt clusters regardless of future model pricing drops. |
| Class A / Class F / Class T / Class N Shares | Class A capped at 49.9%; 1 Class F share = 50.1% | Public (A), Founders (F), LTBT Trust (T), GOOGL/AMZN (N) | Public IPO buyers get minority voting power; Long-Term Benefit Trust controls the board. |
Dario Amodei's Two Essays vs. The S-1 Balance Sheet: How Much Does a 'Country of Geniuses' Cost?
To understand why Anthropic signed $518 billion in non-cancellable cloud leases, you have to read Dario Amodei's two foundational essays side by side with the S-1 risk factors. In October 2024, Dario published Machines of Loving Grace: How AI Could Transform the World for the Better. In that essay, he coined the phrase "a country of geniuses in a datacenter": millions of autonomous frontier model instances smarter than Nobel Prize winners, running at 10x to 100x human speed, compressing 50 to 100 years of biological research, cancer cures, neuroscience, and economic development into a single 5 to 10 year window.
Fifteen months later, in January 2026, Dario published the darker companion essay, The Adolescence of Technology: Confronting and Overcoming the Risks of Powerful AI. Opening with Carl Sagan's famous question from Contact ("How did you survive this technological adolescence without destroying yourself?"), Dario mapped out five existential danger zones: autonomous alignment failures ("I'm sorry, Dave"), biological and cyber weaponization ("A surprising and terrible empowerment"), authoritarian surveillance ("The odious apparatus"), and in Section 4, titled "Player piano" after Kurt Vonnegut's novel, the risk of extreme economic disruption and wealth concentration in a tiny handful of compute-owning entities.
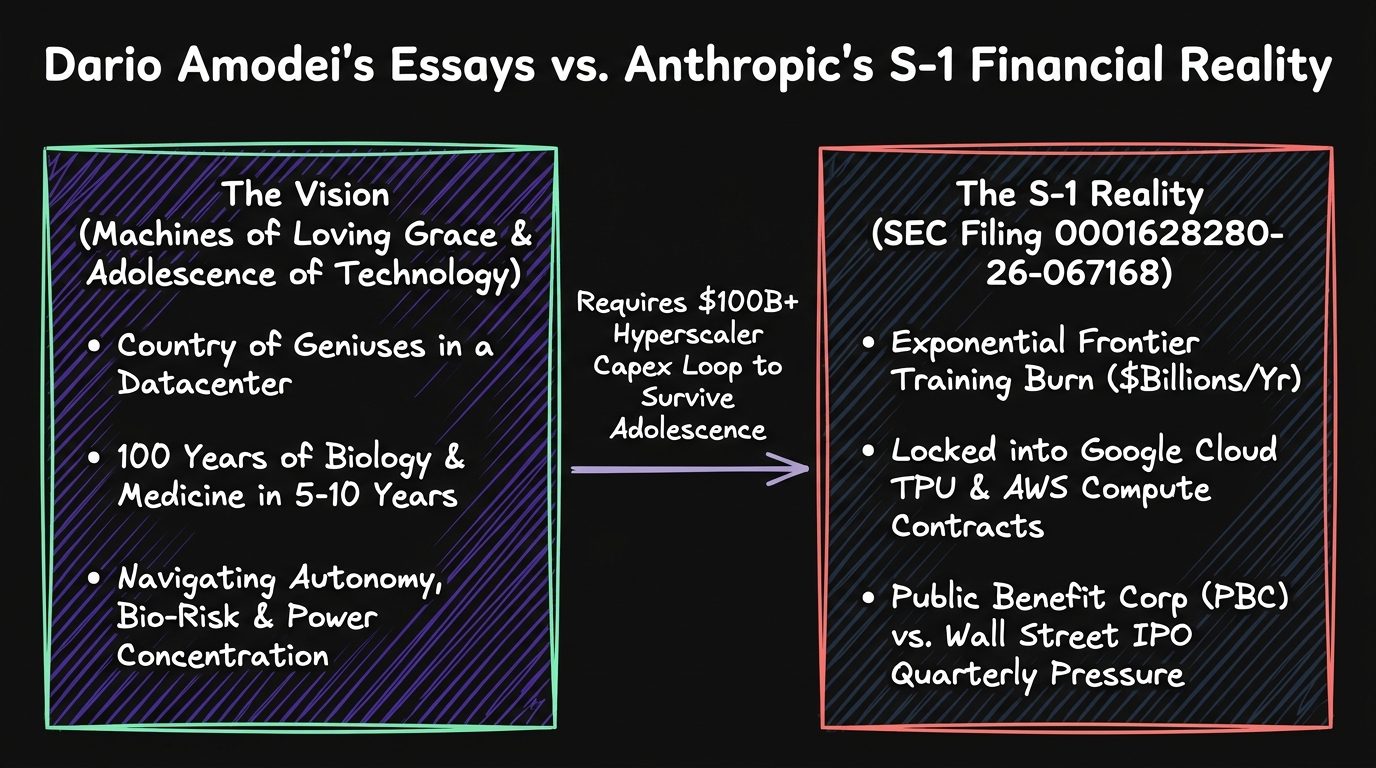
Here is the central paradox exposed by the S-1 filing: in The Adolescence of Technology, Dario warns that AI could concentrate unprecedented economic power in a few giant corporations. Yet nine months later, Anthropic's S-1 proves that surviving the compute race to build that "country of geniuses" required signing over $518 billion in take-or-pay infrastructure contracts to Google, Amazon, Microsoft, NVIDIA, and Broadcom. Even with Anthropic's Long-Term Benefit Trust (Class T shares) and founder super-voting stock (Class F controlling 50.1%), a Public Benefit Corporation that owes half a trillion dollars in non-cancellable cloud rent cannot simply pause the treadmill when Wall Street expects quarterly growth.
Who Actually Runs on Whom? Deep Breakdown of the 7 AI Titans' Frenemy Stack
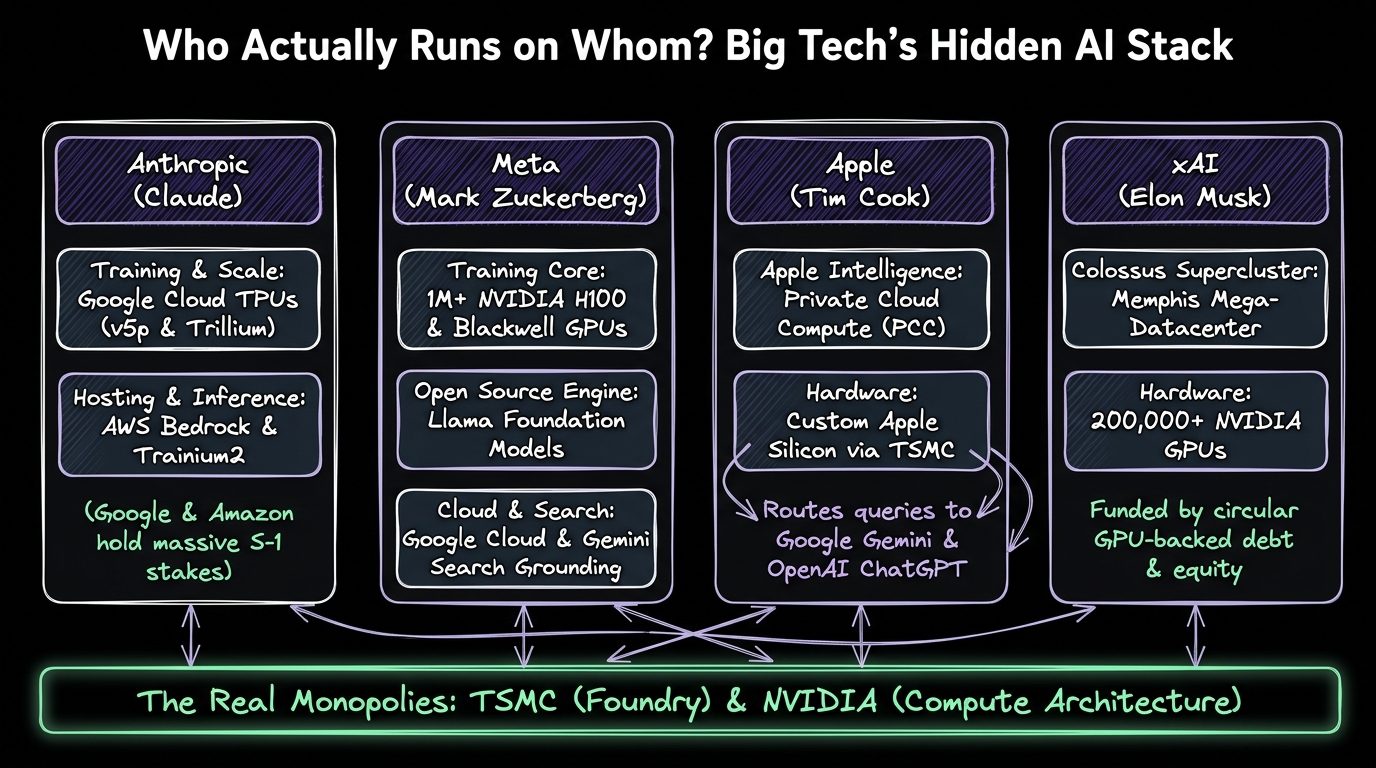
In public, Mark Zuckerberg, Elon Musk, Jensen Huang, Sundar Pichai, Satya Nadella, and Tim Cook position their companies as fierce rivals fighting for AI dominance. Under the hood, their infrastructure stacks are completely entangled. Every "competitor" is simultaneously a customer, supplier, landlord, or venture investor in the others:
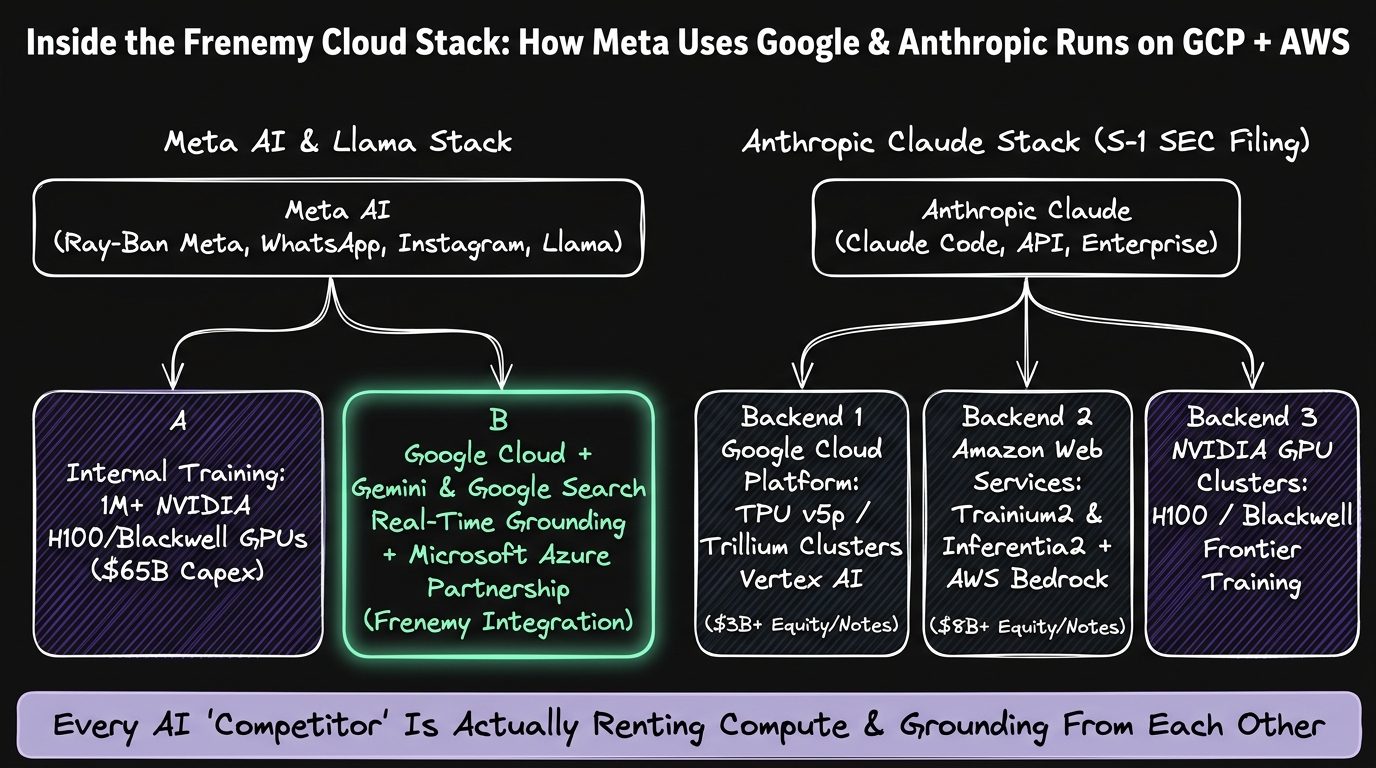
| Leader & Company | 2026 Annual AI Capex | Circular Investment & Equity Stakes | Hidden Frenemy Stack Dependencies |
|---|---|---|---|
| Sundar Pichai (Google / Alphabet) | $195B to $205B | Up to $40B in Anthropic (~14% non-voting Class N stake) | Hosts Anthropic on GCP TPUs ($114.5B obligation); powers Apple Intelligence with Gemini; provides Google Cloud & Search grounding to Meta AI. |
| Satya Nadella (Microsoft) | ~$175B | $14B+ in OpenAI, plus stakes in Anthropic, Mistral, G42 | Collects Azure compute spend from both OpenAI and Anthropic ($31.4B to $44.9B S-1 obligation); hosts Llama, Grok, and Claude on Azure Foundry. |
| Jensen Huang (NVIDIA) | Hardware Arms Dealer (~80% Gross Margin) | Invests in OpenAI, xAI, CoreWeave, Mistral, Perplexity, Scale AI, Lambda | Gets ~45% to 50%+ of Data Center revenue from Microsoft, Meta, Google, Amazon, and xAI; relies 100% on TSMC 3nm/2nm and CoWoS packaging. |
| Mark Zuckerberg (Meta Platforms) | $130B to $145B+ | Open-weights Llama strategy to commoditize paid model APIs | Buys 1M+ NVIDIA H100/Blackwell GPUs; uses Google Cloud and Google Search/Gemini grounding plus Microsoft Azure for Meta AI and Ray-Ban Meta glasses. |
| Elon Musk (xAI & Tesla) | $12B+ per cluster round (Colossus 1 & 2) | Backed by NVIDIA, AMD, Valor, a16z, and sovereign funds (MGX, QIA, PIF) | Memphis Colossus supercluster runs 200k to 500k+ NVIDIA GPUs via Dell/Supermicro racks; distributes Grok on Microsoft Azure Foundry. |
| Tim Cook (Apple) | Capex-light (On-device silicon + Private Cloud) | Zero mega-capex burn; monetizes 2.2B+ iOS/macOS distribution | Routes Apple Intelligence queries to Google Gemini, OpenAI ChatGPT, and Anthropic Claude; depends on TSMC 3nm/2nm fabs for Apple Silicon. |
| Andy Jassy & Jeff Bezos (Amazon / AWS) | $100B to $150B+ | Up to $33B in Anthropic ($8B initial notes + $25B expansion) | Primary cloud/training partner for Anthropic ($110B commitment through 2036 on AWS Trainium2/Inferentia2 Project Rainier); takes ~16% Bedrock cut. |
Show Me the Code: Tracing a 'Multi-Model' Request Through the Frenemy Cloud Tollbooth
As Solutions Engineers and full-stack developers, we often design multi-provider model routers assuming we are diversifying our vendor risk across Anthropic, Meta, Google, and Apple. In reality, when you trace a production request in TypeScript, your API call hits the exact same three cloud balance sheets and two hardware bottlenecks. Here is what a real-world enterprise router telemetry audit looks like when you account for the underlying cloud host, custom silicon, and marketplace cut disclosed in Anthropic's S-1:
// src/lib/frenemy-stack-audit.ts
export interface ModelRouteAudit {
  logicalProvider: "anthropic-claude" | "meta-llama" | "apple-intelligence" | "xai-grok";
  physicalCloudHost: "google-cloud-vertex" | "aws-bedrock" | "azure-foundry" | "xai-colossus";
  acceleratorSilicon: "gcp-tpu-v5p-trillium" | "aws-trainium2" | "nvidia-blackwell-b200";
  foundryMonopoly: "TSMC-3nm-CoWoS";
  grossSpendUsd: number;
  hyperscalerMarketplaceCutUsd: number;
  recycledCapexObligationBln: number;
}

const S1_MARKETPLACE_FEE_RATE = 0.16; // ~16% AWS Bedrock & GCP Vertex AI fee disclosed in S-1

export function auditFrenemyCloudFlow(
  route: ModelRouteAudit["logicalProvider"],
  backend: ModelRouteAudit["physicalCloudHost"],
  monthlySpendUsd: number
): ModelRouteAudit {
  switch (route) {
    case "anthropic-claude": {
      const isGcp = backend === "google-cloud-vertex";
      return {
        logicalProvider: "anthropic-claude",
        physicalCloudHost: backend,
        acceleratorSilicon: isGcp ? "gcp-tpu-v5p-trillium" : "aws-trainium2",
        foundryMonopoly: "TSMC-3nm-CoWoS",
        grossSpendUsd: monthlySpendUsd,
        // 47% of Anthropic's 2025 revenue ran through AWS/GCP marketplaces at ~16% fee
        hyperscalerMarketplaceCutUsd: Number((monthlySpendUsd * S1_MARKETPLACE_FEE_RATE).toFixed(2)),
        // Google Cloud ($114.5B) + AWS ($110B) + Azure ($44.9B) S-1 commitments
        recycledCapexObligationBln: isGcp ? 114.5 : backend === "aws-bedrock" ? 110.0 : 44.9,
      };
    }
    case "meta-llama":
      return {
        logicalProvider: "meta-llama",
        physicalCloudHost: backend, // Often served via Google Cloud, AWS Bedrock, or Azure
        acceleratorSilicon: "nvidia-blackwell-b200",
        foundryMonopoly: "TSMC-3nm-CoWoS",
        grossSpendUsd: monthlySpendUsd,
        hyperscalerMarketplaceCutUsd: Number((monthlySpendUsd * S1_MARKETPLACE_FEE_RATE).toFixed(2)),
        recycledCapexObligationBln: 140.0, // Meta's 2026 annual AI capex run-rate
      };
    default:
      return {
        logicalProvider: route,
        physicalCloudHost: backend,
        acceleratorSilicon: "nvidia-blackwell-b200",
        foundryMonopoly: "TSMC-3nm-CoWoS",
        grossSpendUsd: monthlySpendUsd,
        hyperscalerMarketplaceCutUsd: 0,
        recycledCapexObligationBln: 100.0,
      };
  }
}
AJ Pro-Tip from Alex: If your engineering org routes production traffic to Claude through AWS Bedrock and fails over to Claude on Google Cloud Vertex AI, you have cloud region redundancy, which is great for uptime. Just do not confuse multi-cloud routing with financial independence: both endpoints pay a ~16% marketplace toll to Anthropic's two biggest convertible-note holders, and every single TPU and Trainium2 chip underneath those endpoints is fabricated on TSMC 3nm CoWoS lines.
The Passive Index Funnel: How VOO, SPY, QQQ, VTI, FXAIX, and VT Put Every 401(k) in One AI Trade
You might think: "I don't buy private AI venture rounds or IPOs like ANT, I just dollar-cost average into low-cost index funds in my 401(k) and IRA." Because modern index funds are market-cap weighted, passive investing has turned into a giant momentum funnel. Every two weeks, automatic paycheck contributions from tens of millions of workers allocate 33% to nearly 50% of every retirement dollar into the exact eight companies passing AI capex back and forth.
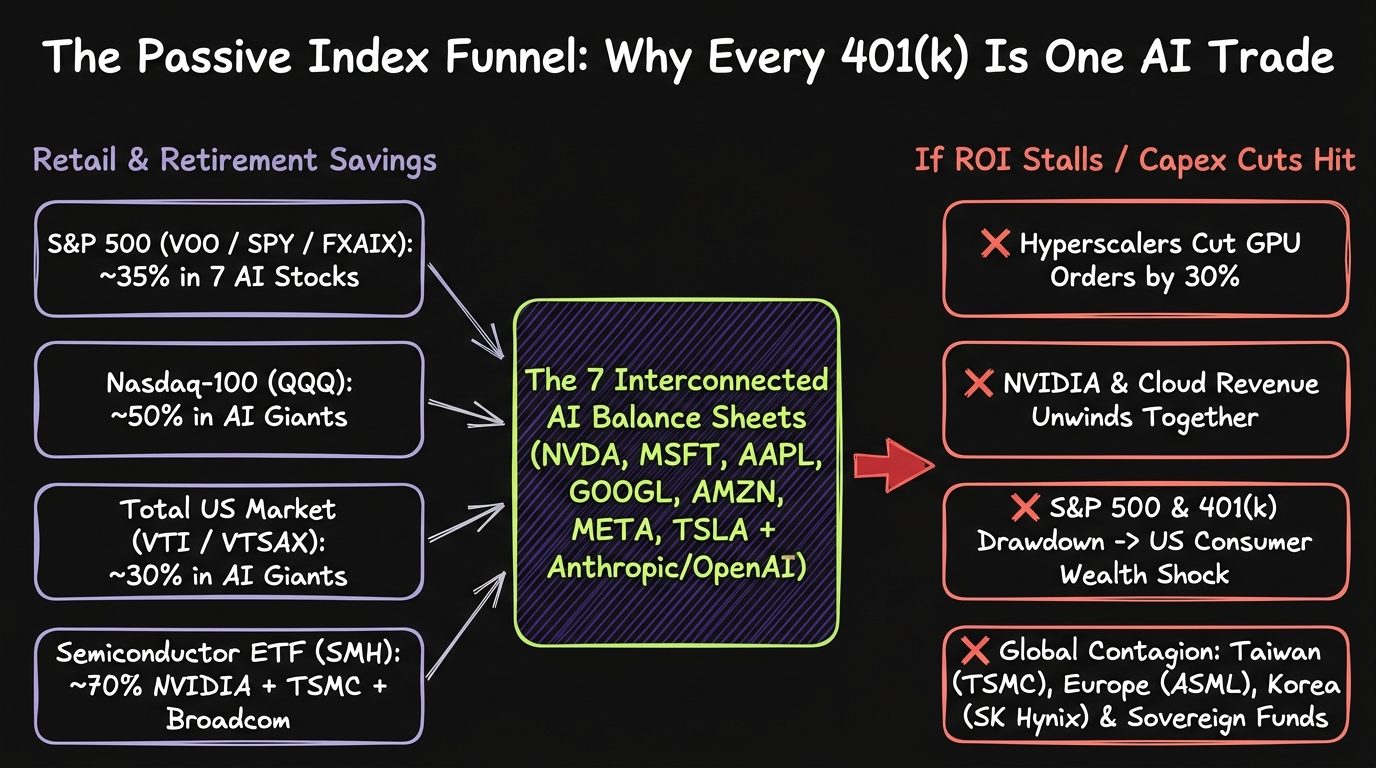
| Company (Ticker) | S&P 500 (SPY, VOO, IVV, FXAIX, VFIAX) | Nasdaq-100 (QQQ, QQQM) | Total US Market (VTI, VTSAX) | US Tech Sector (XLK / VGT) | Semiconductors (SMH / SOXX) | Total World & Intl (VT / VXUS) |
|---|---|---|---|---|---|---|
| NVIDIA (NVDA) | 8.1% to 8.4% | 9.0% to 9.5% | ~7.1% | 20.5% (XLK) / 16.8% (VGT) | 20.5% (SMH) / 6.8% (SOXX) | 4.3% (VT) |
| Apple (AAPL) | 7.0% to 7.4% | 8.5% to 8.9% | ~6.6% | 14.6% (VGT) | 0.0% | 3.8% (VT) |
| Microsoft (MSFT) | 5.7% to 5.8% | 7.8% to 8.2% | ~5.2% | 19.5% (XLK) / 9.5% (VGT) | 0.0% | 3.2% (VT) |
| Alphabet (GOOGL / GOOG) | 5.4% to 5.5% | 5.2% to 5.6% | ~4.9% | Excluded (Comm. Services) | 0.0% | 3.0% (VT) |
| Amazon (AMZN) | 3.7% to 3.8% | 5.1% to 5.4% | ~3.3% | Excluded (Cons. Discret.) | 0.0% | 2.1% (VT) |
| Broadcom (AVGO) | 2.6% to 2.7% | 4.5% to 5.0% | ~2.3% | 4.8% (XLK) / 4.1% (VGT) | 8.5% (SMH) / 6.1% (SOXX) | 1.3% (VT) |
| Meta Platforms (META) | 1.9% to 2.5% | 3.5% to 4.5% | 1.7% to 2.1% | Excluded (Comm. Services) | 0.0% | 1.2% (VT) |
| Tesla (TSLA) | 1.5% to 2.0% | 2.5% to 3.2% | 1.4% to 1.7% | Excluded (Cons. Discret.) | 0.0% | 0.9% (VT) |
| TSMC (TSM) + ASML + SK Hynix | Excluded (Non-US) | ~0.8% (ASML only) | Excluded (Non-US) | Excluded | 16.3% (SMH: TSM + ASML) | 2.4% (VT) / 7.0%+ (VXUS) |
| Combined AI Capex Cohort Weight | 36.0% to 38.0% of S&P 500 | 46.0% to 49.0% of Nasdaq-100 | 32.5% to 34.0% of Total US | 45% to 55% in 3 to 4 stocks | 45%+ in NVDA, TSM, AVGO, ASML | 22.2% of Planet (VT) / 8.5% Intl |
Look closely at the rightmost column of that table. Even investors who buy VXUS (Vanguard Total International Stock ETF) thinking they are diversifying outside US Big Tech find that their #1 international holding is TSMC (~4.1%), followed closely by ASML (~1.5%), SK Hynix (~1.4%), and Samsung. And once Anthropic completes its Nasdaq listing under ANT at a projected $1T to $2T valuation, it will be added directly into QQQ, VTI, and eventually VOO and SPY. That means passive 401(k) holders will simultaneously own Anthropic (and its $518B cloud debt) AND the hyperscaler landlords collecting that debt.
What Happens to the US and Global Economy If the Circular AI Capex Loop Fails?
What happens if enterprise AI revenue grows slower than required to justify $700 billion to $800 billion per year in hyperscaler capital expenditures, or if algorithmic breakthroughs allow smaller models to run at 10% of today's compute cost? Because the circular loop connects corporate earnings, GDP accounting, utility grids, and global semiconductor exports, an unwind hits five macroeconomic fault lines at once:
| Contagion Vector | Current 2026 Exposure Scale | Accounting / Structural Mechanism | Impact If Hyperscaler Capex Cuts 30% to 40% |
|---|---|---|---|
| 1. Real US GDP Growth | $700B to $800B/yr CapEx (~2.6% of US GDP) | BEA counts AI servers, GPUs, and data center construction as Non-Residential Fixed Investment (30% to 50%+ of recent GDP growth). | Immediate 0.75% to 1.2% subtraction from headline US GDP, triggering a technical recession before layoffs even peak. |
| 2. S&P 500 Earnings & Depreciation Trap | ~50% of S&P 500 EPS growth tied to AI cycle | NVIDIA/Broadcom book GPU sales as immediate revenue; MSFT/GOOGL/AMZN capitalize GPUs as PP&E and depreciate over 4 to 6 years. | Double whammy: chipmaker revenue drops immediately while hyperscalers are crushed by $150B+/yr in locked-in depreciation charges. |
| 3. US 401(k)s & Consumer Wealth Effect | 42% to 48% of US household financial assets in equities | Top 8 AI stocks represent ~$20T in market cap; every $1 lost in equity wealth reduces consumer spending by $0.03 to $0.05. | A 40% AI valuation reset wipes out $8T to $10T in household net worth and cuts US consumer spending by $300B to $500B. |
| 4. Power Grids & Municipal Bonds | Multi-gigawatt gas/nuclear buildouts (VA, TX, OH, TN) | Data centers take 24 months to build; utility turbines and transmission lines take 5 to 10 years and amortize over 30 to 40 years. | Stranded utility debt is socialized onto residential electricity bills via rate-base hikes; municipal bond downgrades in data center towns. |
| 5. Global Semiconductor & Sovereign Contagion | Taiwan (TSMC), Korea (SK Hynix), Europe (ASML), Gulf SWFs | US designs the models, while Asia and Europe own the high-fixed-cost physical fabs; Sovereign funds (MGX, PIF, QIA, GIC) hold private equity. | Immediate export recession in Taiwan and South Korea (HBM memory glut), EUV order cancellations in Europe, and sovereign write-downs. |
The most dangerous accounting detail in that table is the Capex-to-Depreciation asymmetry. When Microsoft, Google, or Amazon spends $100 billion on NVIDIA Blackwell racks and Broadcom TPUs today, NVIDIA and Broadcom book $100 billion of immediate top-line revenue and $60B+ of net profit in the current quarter. Meanwhile, Microsoft, Google, and Amazon do not expense that $100 billion on their income statements today: they capitalize the servers as Property, Plant, and Equipment (PP&E) and depreciate them over four to six years. That makes S&P 500 earnings look artificially high during the buildout phase, and guarantees a multi-year depreciation hangover the moment capex growth slows down.
Frequently Asked Questions (FAQ)
What did Anthropic disclose in its 2026 Form S-1 SEC filing?
In its October 26, 2026 Form S-1 registration statement (CIK 0002130357, ticker ANT), Anthropic disclosed $16.286 billion in H1 2026 revenue (up from $4.6 billion in full-year 2025), an $80.748 billion H1 2026 GAAP net loss driven by $72.388 billion in non-cash convertible note mark-to-market revaluations, and between $450 billion and $518 billion in multi-year non-cancellable cloud compute commitments across Google Cloud ($111.1B to $114.5B), AWS ($110B), and Microsoft Azure ($31.4B to $44.9B).
How does circular AI financing (round-tripping) work between Google, AWS, Microsoft, NVIDIA, and AI labs?
In circular AI financing, hyperscalers and chipmakers (Google, Amazon, Microsoft, NVIDIA) invest tens of billions of dollars in equity or convertible notes into AI model labs and neoclouds (Anthropic, OpenAI, xAI, CoreWeave). In exchange, those AI labs sign multi-decade take-or-pay contracts obligating them to spend that capital, plus roughly 16% marketplace distribution fees, renting cloud TPUs, Trainium2 chips, and NVIDIA GPUs right back from the investors.
How much of the S&P 500 and Nasdaq-100 ETFs is concentrated in the circular AI economy?
As of late 2026, the eight primary US AI capex stocks (NVIDIA, Apple, Microsoft, Alphabet, Amazon, Broadcom, Meta, and Tesla) account for roughly 36% to 38% of S&P 500 ETFs and mutual funds (VOO, SPY, IVV, FXAIX, VFIAX), 46% to 49% of the Nasdaq-100 (QQQ), and 32.5% to 34% of the Total US Stock Market (VTI, VTSAX), while TSMC, ASML, and SK Hynix represent over 7% of international index funds (VXUS).
Conclusion: Build on the Models, Watch the Balance Sheets
Make no mistake: the engineering breakthroughs inside Claude, Gemini, Llama, and Grok are real, and we use them every single day in production at CodingCat.dev. But as Anthropic's Form S-1 makes crystal clear, the financial plumbing underneath those models is a high-wire act of $518 billion take-or-pay cloud mortgages and circular hyperscaler capex. Come tell us on X (@CodingCatDev) and LinkedIn what you think of Anthropic's S-1 numbers, watch our architectural deep dives on the CodingCat.dev YouTube Channel, and explore more hands-on Courses, Podcasts, and Blog Posts right here on CodingCat.dev.